How to Compare Multiple CSV Files Quickly (Without Manual Work)
Working with CSV files is straightforward until there are multiple files to compare.
Instead of analyzing a single dataset, many workflows involve handling an entire folder of CSV or Excel files. Comparing them efficiently can quickly become time-consuming.
The Challenge of Multiple CSV Files
Most tools are designed for working with one file at a time. When dealing with multiple files, the process often involves:
- Opening files individually
- Manually combining or aligning data
- Switching between views to compare results
While this approach works, it adds unnecessary steps and slows down analysis.
A Simpler Approach
A more efficient workflow is:
This removes the need for manual preparation and allows faster insights.
Comparing Multiple Files with DataPlotter
DataPlotter provides a simple way to visualize and compare multiple datasets at once.
With folder upload support, it is possible to:
- Upload an entire folder of CSV or Excel files
- Select multiple files for comparison
- Plot them together in a single chart
How It Works
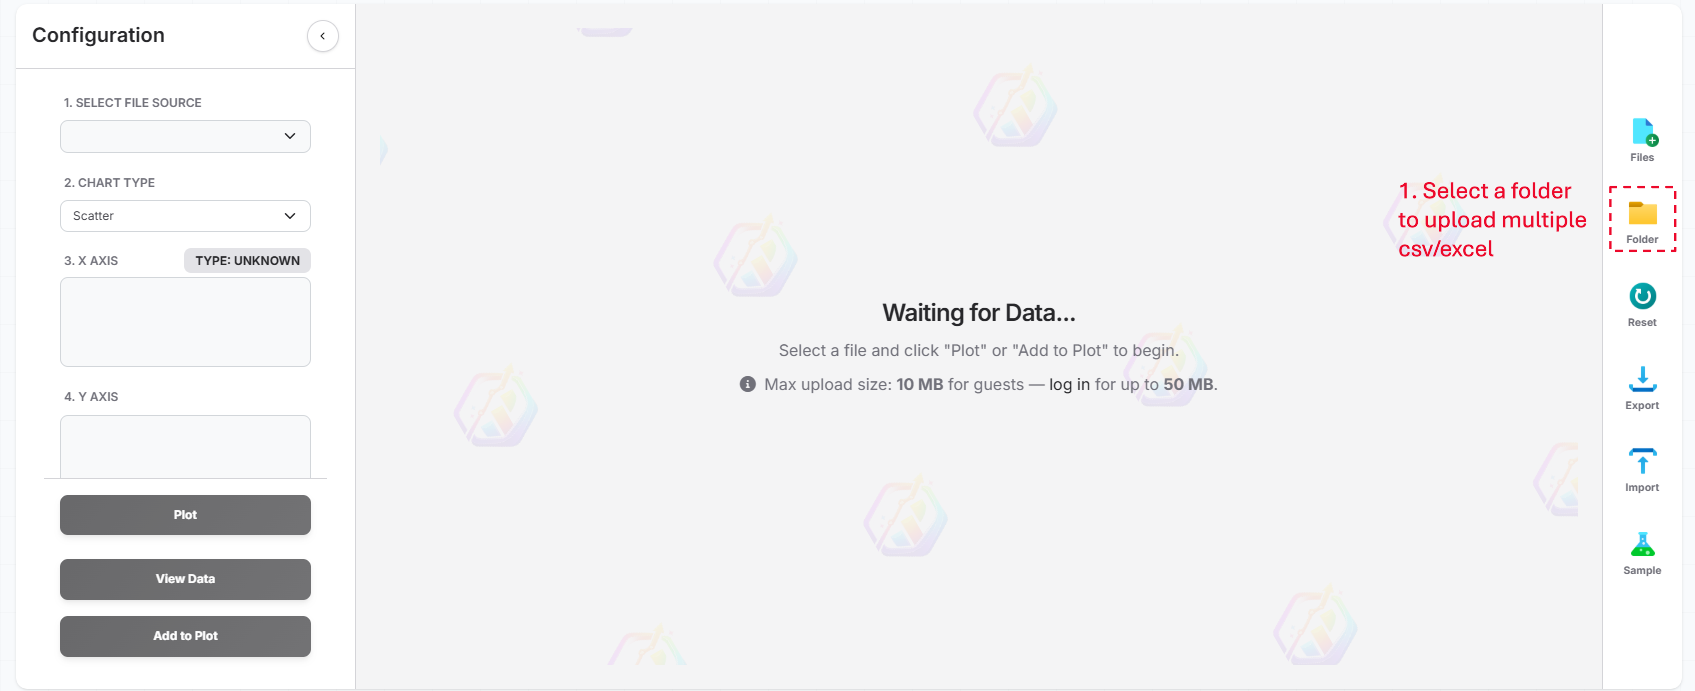
1. Upload a Folder
Instead of the tedious process of selecting files one by one, you can simply upload an entire directory. By using the Upload Folder option:
- Select a folder from your local machine
- Upload all contained CSV and Excel files in a single step
This is a massive time-saver for projects involving dozens of data points, as every dataset becomes available for plotting immediately without repetitive manual uploads.
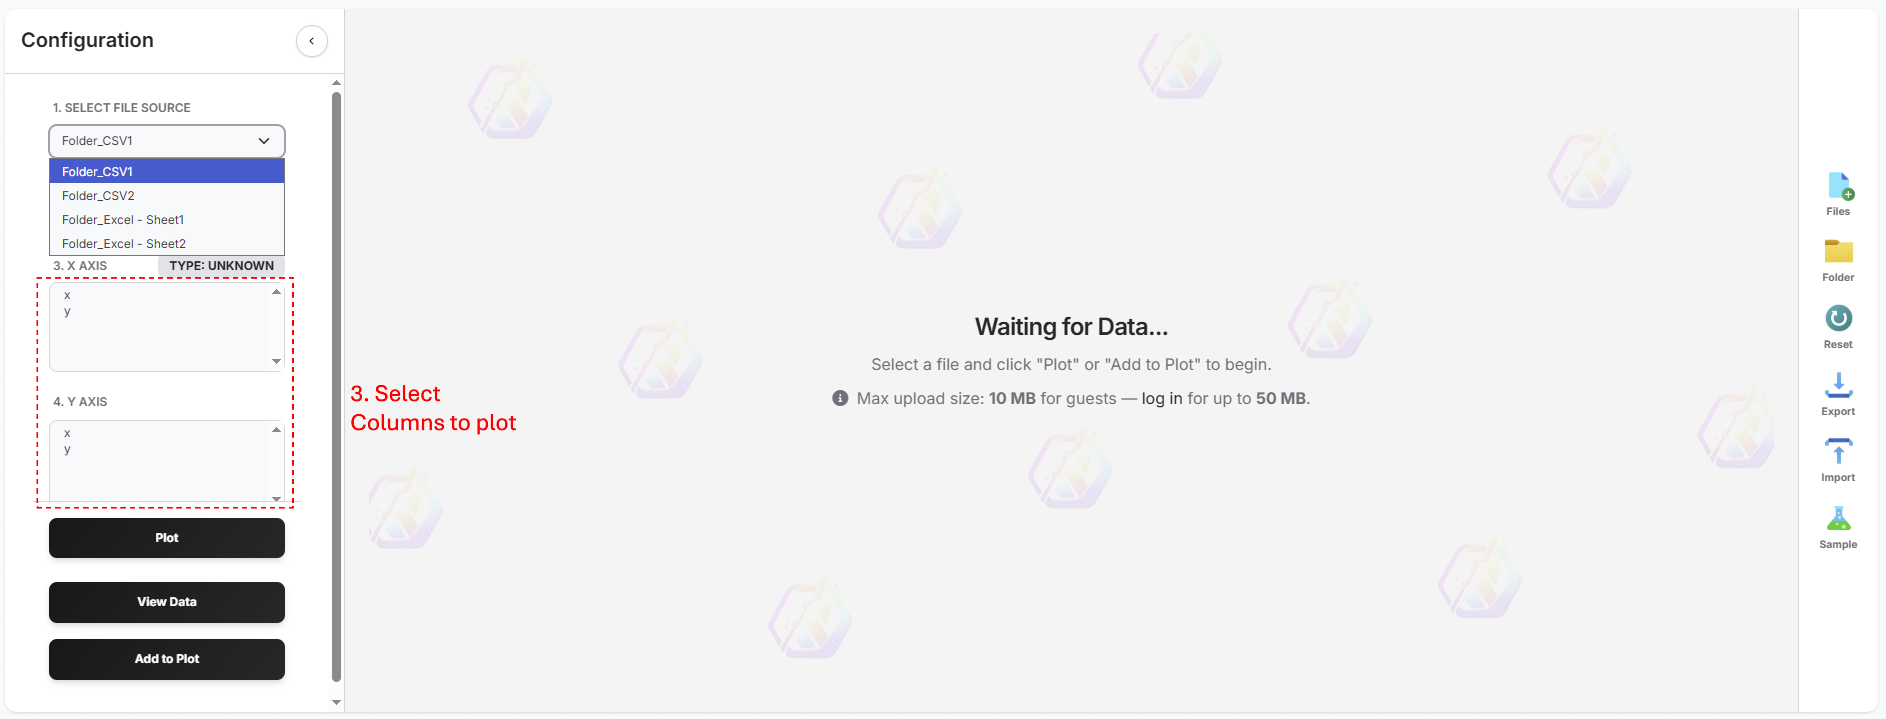
2. Select Files to Compare
Once your folder is uploaded, all individual files populate the File Source list. You have full control over which datasets to include in your visualization:
- Select multiple files from the File Source dropdown menu
- Each selected column from your chosen files is automatically treated as a separate trace
- Compare values across as many (or as few) files as your analysis requires
This flexible selection process lets you filter through an entire folder and instantly visualize specific data points for comparative analysis.

3. Choose X and Y Columns
With your files selected, you can now define your axes. DataPlotter intelligently scans all active files to present you with the available columns. Since each selected column from your various files is treated as an individual trace, this is where your comparison truly takes shape:
- X-axis: Typically your independent variable, like 'Time', 'Date', or 'Index'.
- Y-axis: Your target metrics, such as 'Temperature', 'Pressure', or 'Revenue'.
Simply pick your columns, and the tool will instantly overlay the corresponding data from every file you've selected. No more manual merging or copy-pasting required.
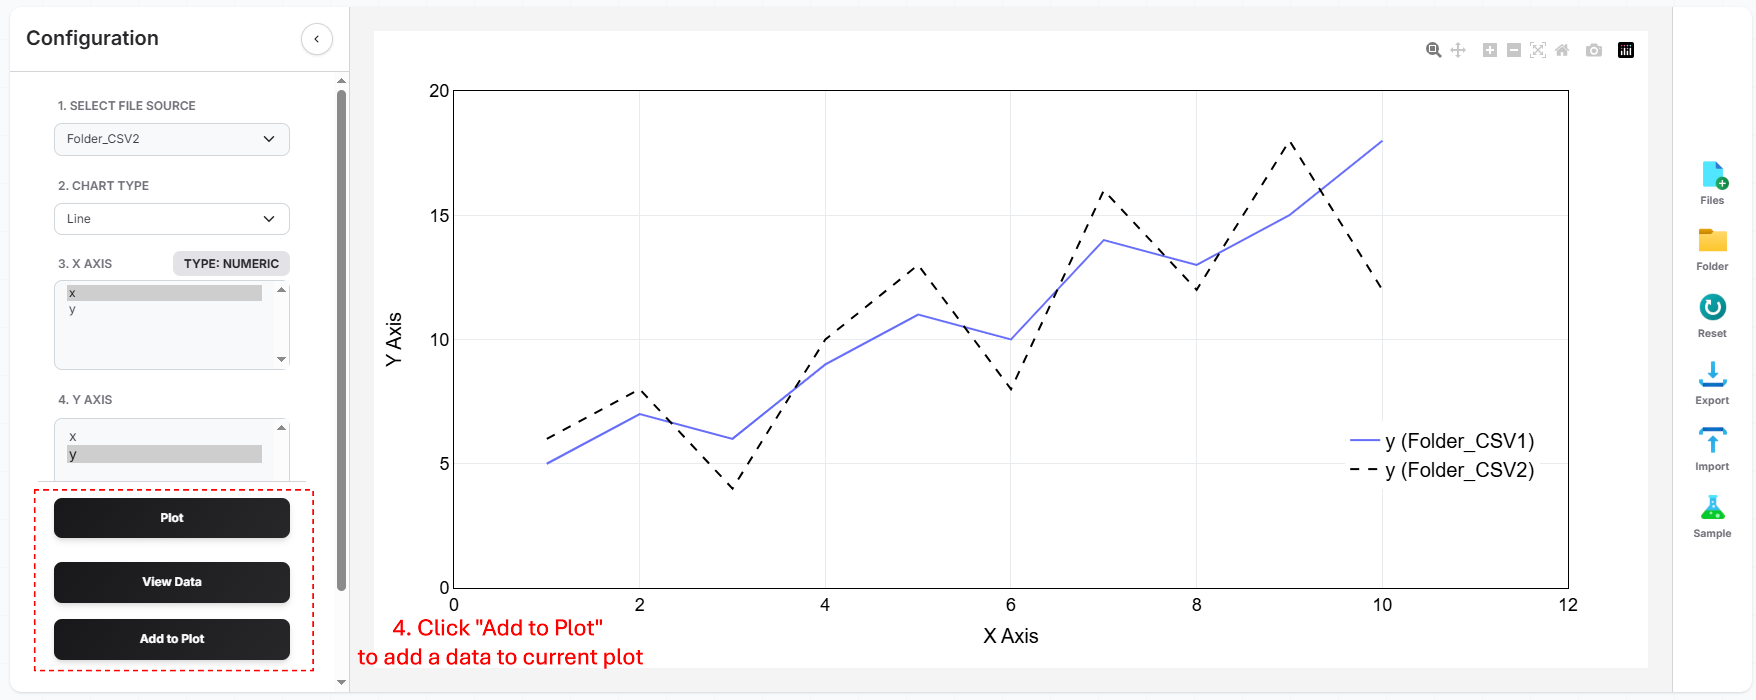
4. Analyze in One View
Once the plot is rendered, the real work begins. Instead of switching between separate windows to see how 'File A' differs from 'File B', you see everything at a glance. You can:
- Isolate Trends: Use the interactive legend to hide or show specific traces for cleaner comparisons.
- Inspect Details: Hover over overlapping lines to see exact values from different files side-by-side.
- Find Patterns: Zoom in on specific time periods to see if differences are consistent or just outliers.
This unified perspective makes it easy to confirm consistent trends and derive conclusions that are nearly impossible to see when datasets are siloed in different files.
Common Use Cases
This multi-file comparative workflow is a game-changer for several scenarios:
- Scientific Research: Overlaying multiple experiment runs to verify repeatability and spot deviations.
- Operations Engineering: Comparing performance logs from different servers or production cycles to detect degradation.
- Business Analytics: Visualizing quarterly reports from different branches in a single, digestible view.
- Quality Control: Plotting batch results from different production lines to ensure they stay within tolerance levels.
Why This Approach Works
The key benefit is the total elimination of the "data preparation" tax. By automating the alignment of multiple files, we've turned a 20-minute manual task into a 30-second workflow. Instead of wasting time on the logistics of merging files, you can focus on the thing that actually matters: deriving value from your data.
Final Thoughts
Comparing multiple CSV files doesn't have to be a multi-step headache. By following the Upload → Select → Compare workflow, you can move from raw data to clear insights in the time it takes to grab a coffee. Next time you face a folder full of exports, let the tool do the heavy lifting.