How to Share Your Plots Securely & Interactively (Without Sending the Raw File)
Sharing charts and insights is easy — but sharing them securely without exposing your entire dataset is not. Usually, we rely on static screenshots, but they limit interaction and lead to repeated back-and-forth.
Whether you're sharing charts with your team, clients, or stakeholders, the challenge is always the same: how do you provide access to interactive insights without handing over your original CSV or Excel files?
This is where a **secure snapshot** becomes essential.
Why Screenshots Fall Short
Screenshots are useful for quick communication, but they come with clear limitations. They capture a single moment in time and remove the ability to explore the data further.
If someone wants to inspect a value, zoom into a specific range, or compare multiple elements, you often need to recreate and resend the visualization.
Interactive sharing removes this friction and allows users to explore the data on their own.
With an interactive link, viewers can:
- Hover to see exact values
- Zoom into specific areas
- Toggle data layers to focus on what matters
This becomes especially valuable when working with stakeholders who need to explore insights independently.
The 3-Pillar Security Model
Secure sharing is not just about access — it's about control. Every shared link is designed with multiple layers of protection:
1. Anonymity
Each link uses a unique, hard-to-guess identifier, making it accessible only to those you share it with.
2. Privacy
Optional password protection adds an extra layer of security, ensuring only authorized viewers can access the plot.
3. Control
You can set expiration dates or revoke access at any time, giving you full control over visibility.
Unlike sending files or screenshots, this approach ensures that no raw data files are directly shared or exposed.
When This Approach Is Useful
- Sharing dashboards with clients without exposing underlying data
- Collaborating with distributed teams
- Presenting insights where users need interactive exploration
- Providing temporary access to sensitive data visualizations
How to Share in 4 Simple Steps
Sharing interactive plots does not require your audience to install anything or create an account.
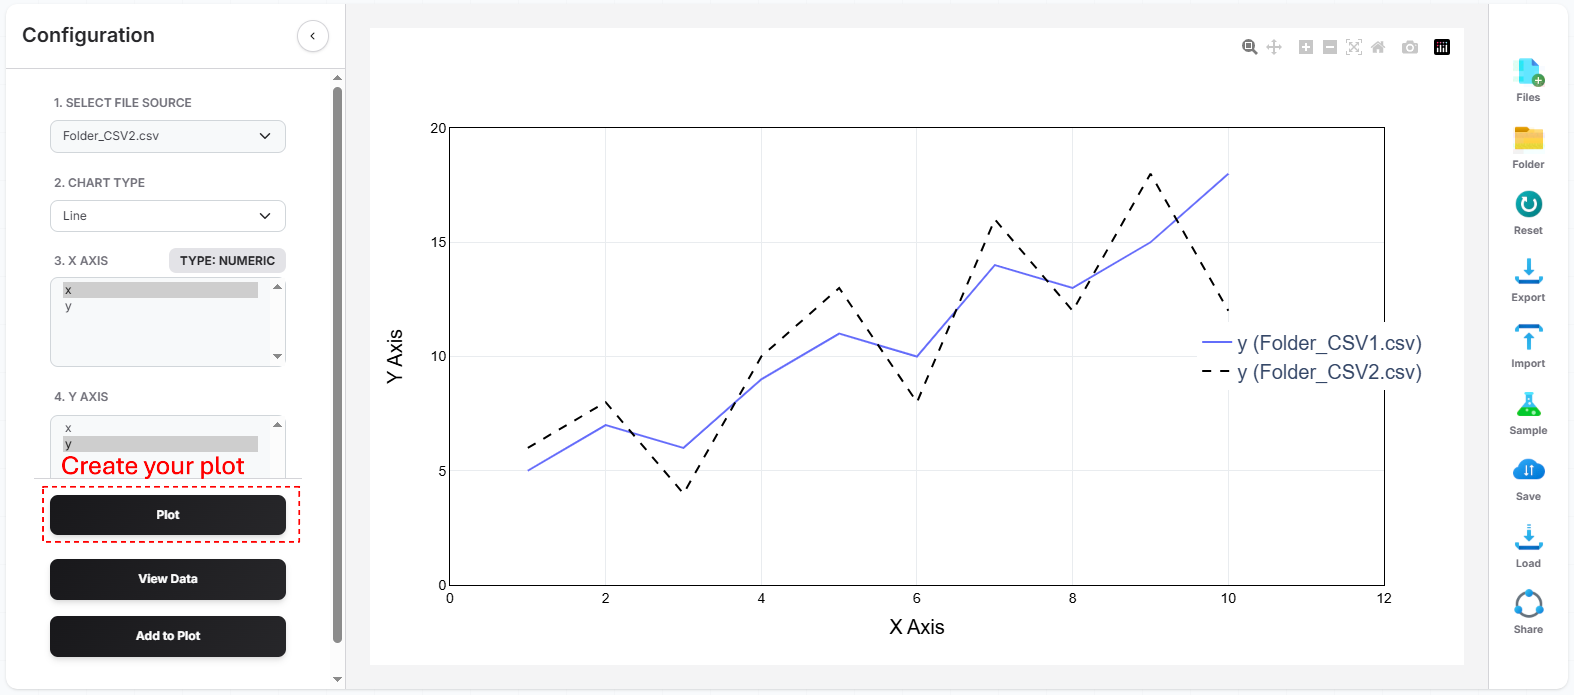
- Create your plot using your dataset (see our guide on how to plot CSV online if you're just getting started)
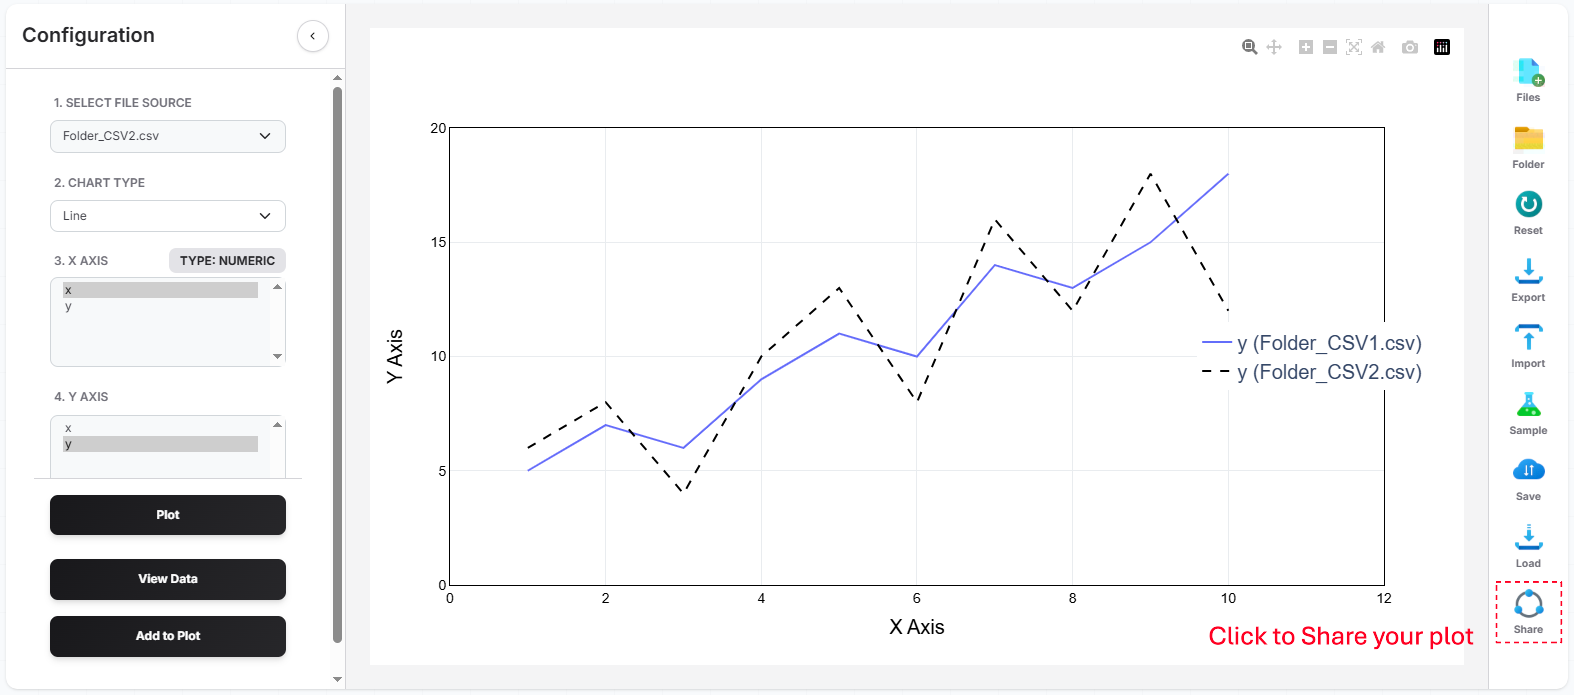
- Click the "Share Plot" option in the toolbar
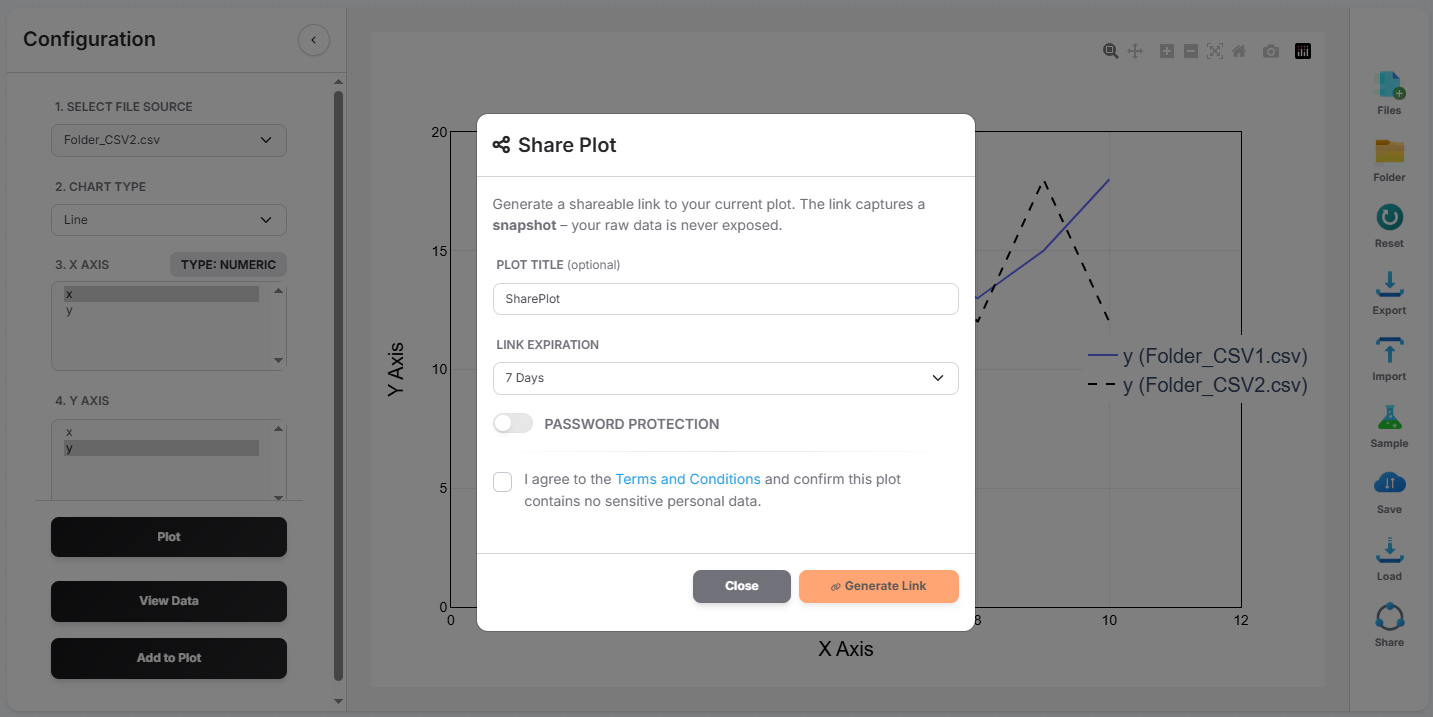
- Configure access by adding a password or expiration date
- Copy and share the link via email or any communication tool
Related Guides
Step-by-step guide to visualizing CSV data instantly in your browser without software.
Upload .xlsx or .xls files directly to create interactive charts without complex formulas.
Ready to share your insights securely?
Create an interactive link and give others access to your data — without sending files or screenshots.
Start Sharing Now